Google Economic Impact

Report + web design

Each year, Google releases a report on the economic impact their tools and programs have on businesses, nonprofits, and communities across the United States. They spotlight their solutions, share data, and highlight stories from the small businesses and organizations that grew with the help of the internet and the part Google plays on the web.

The Project

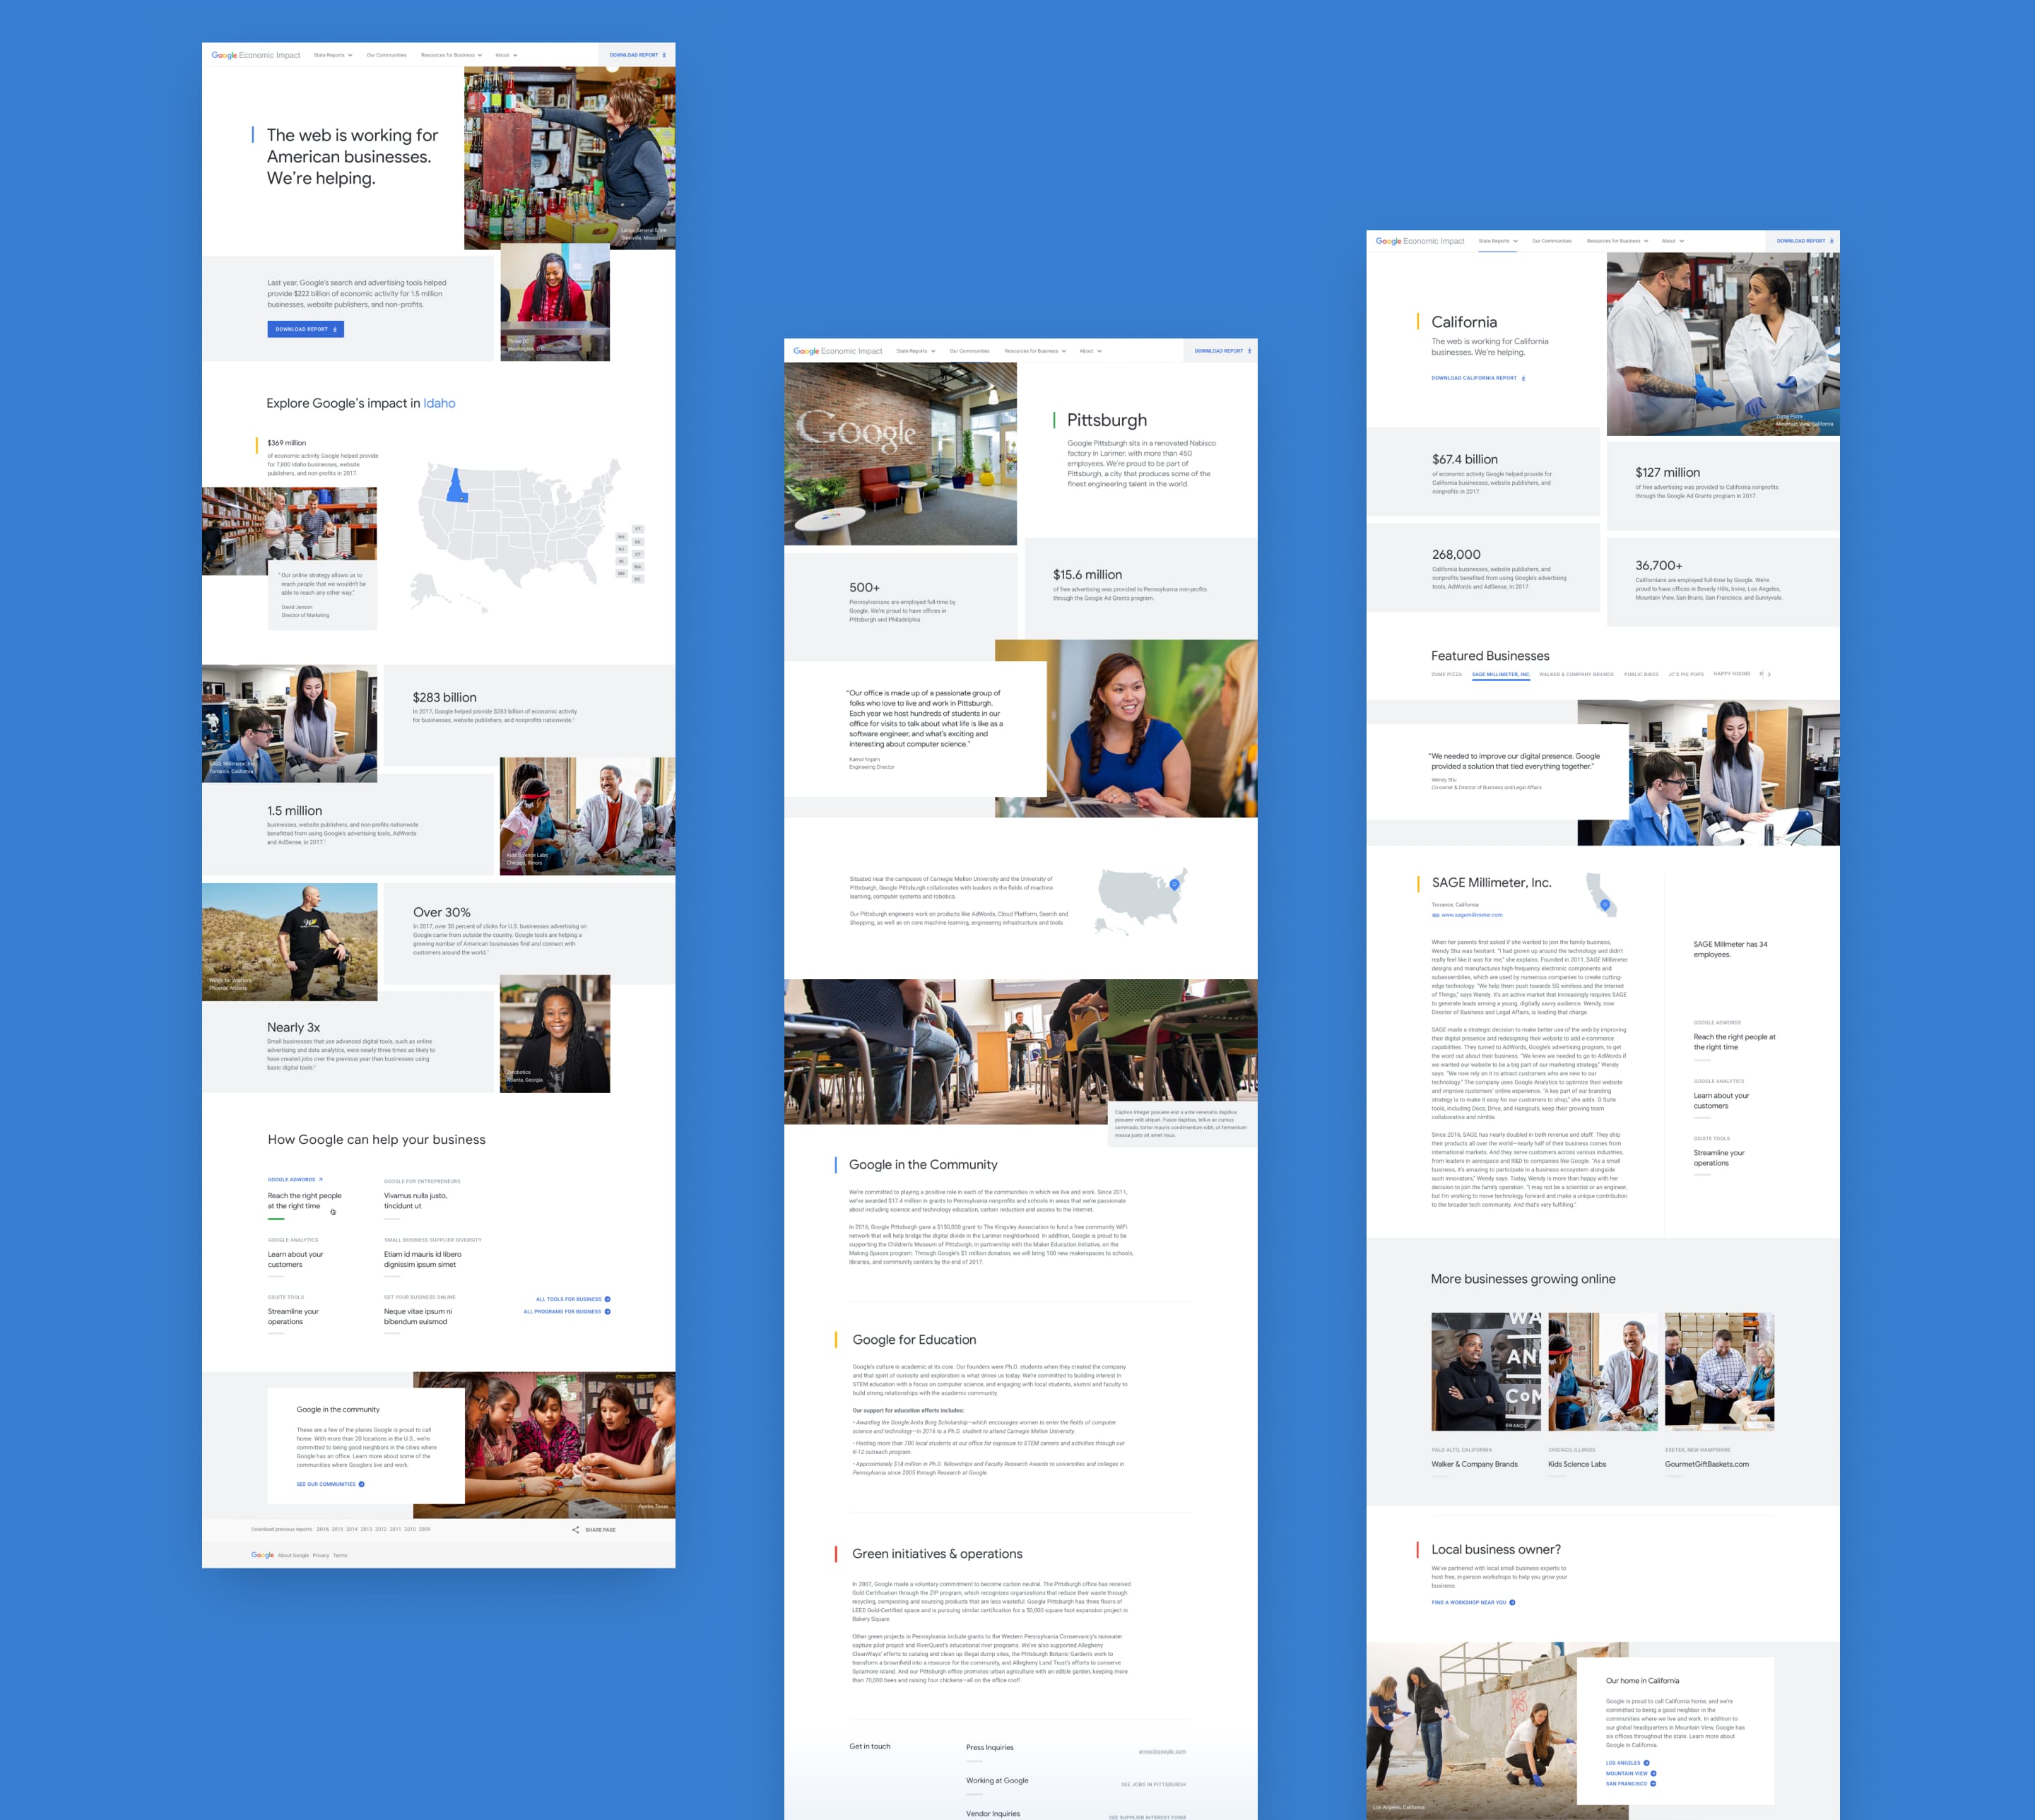
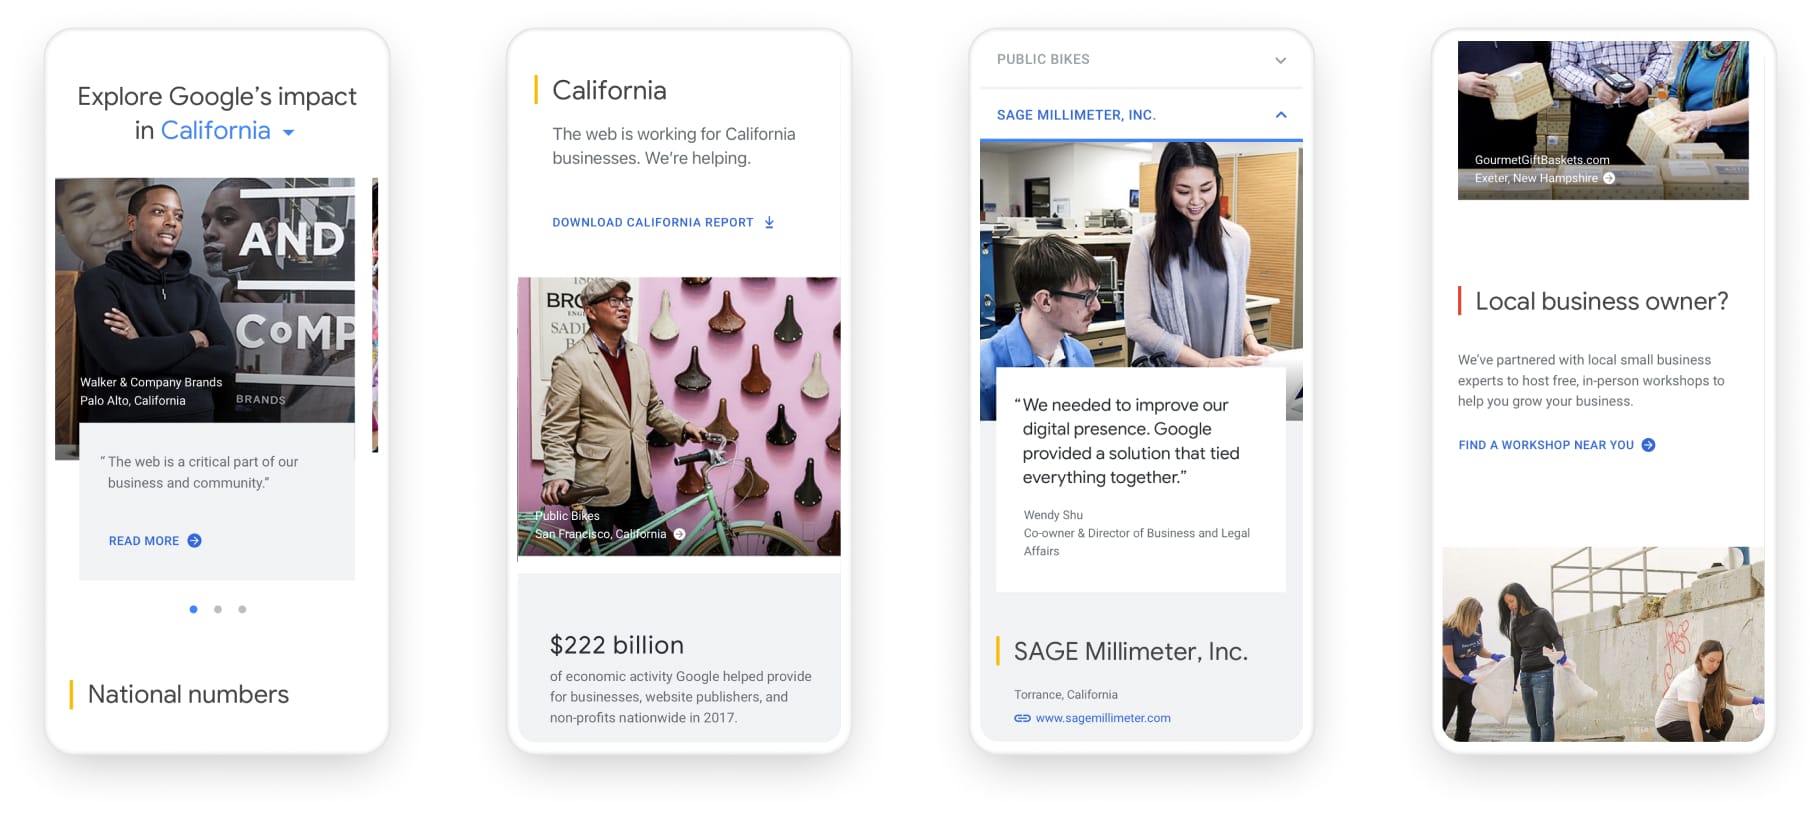
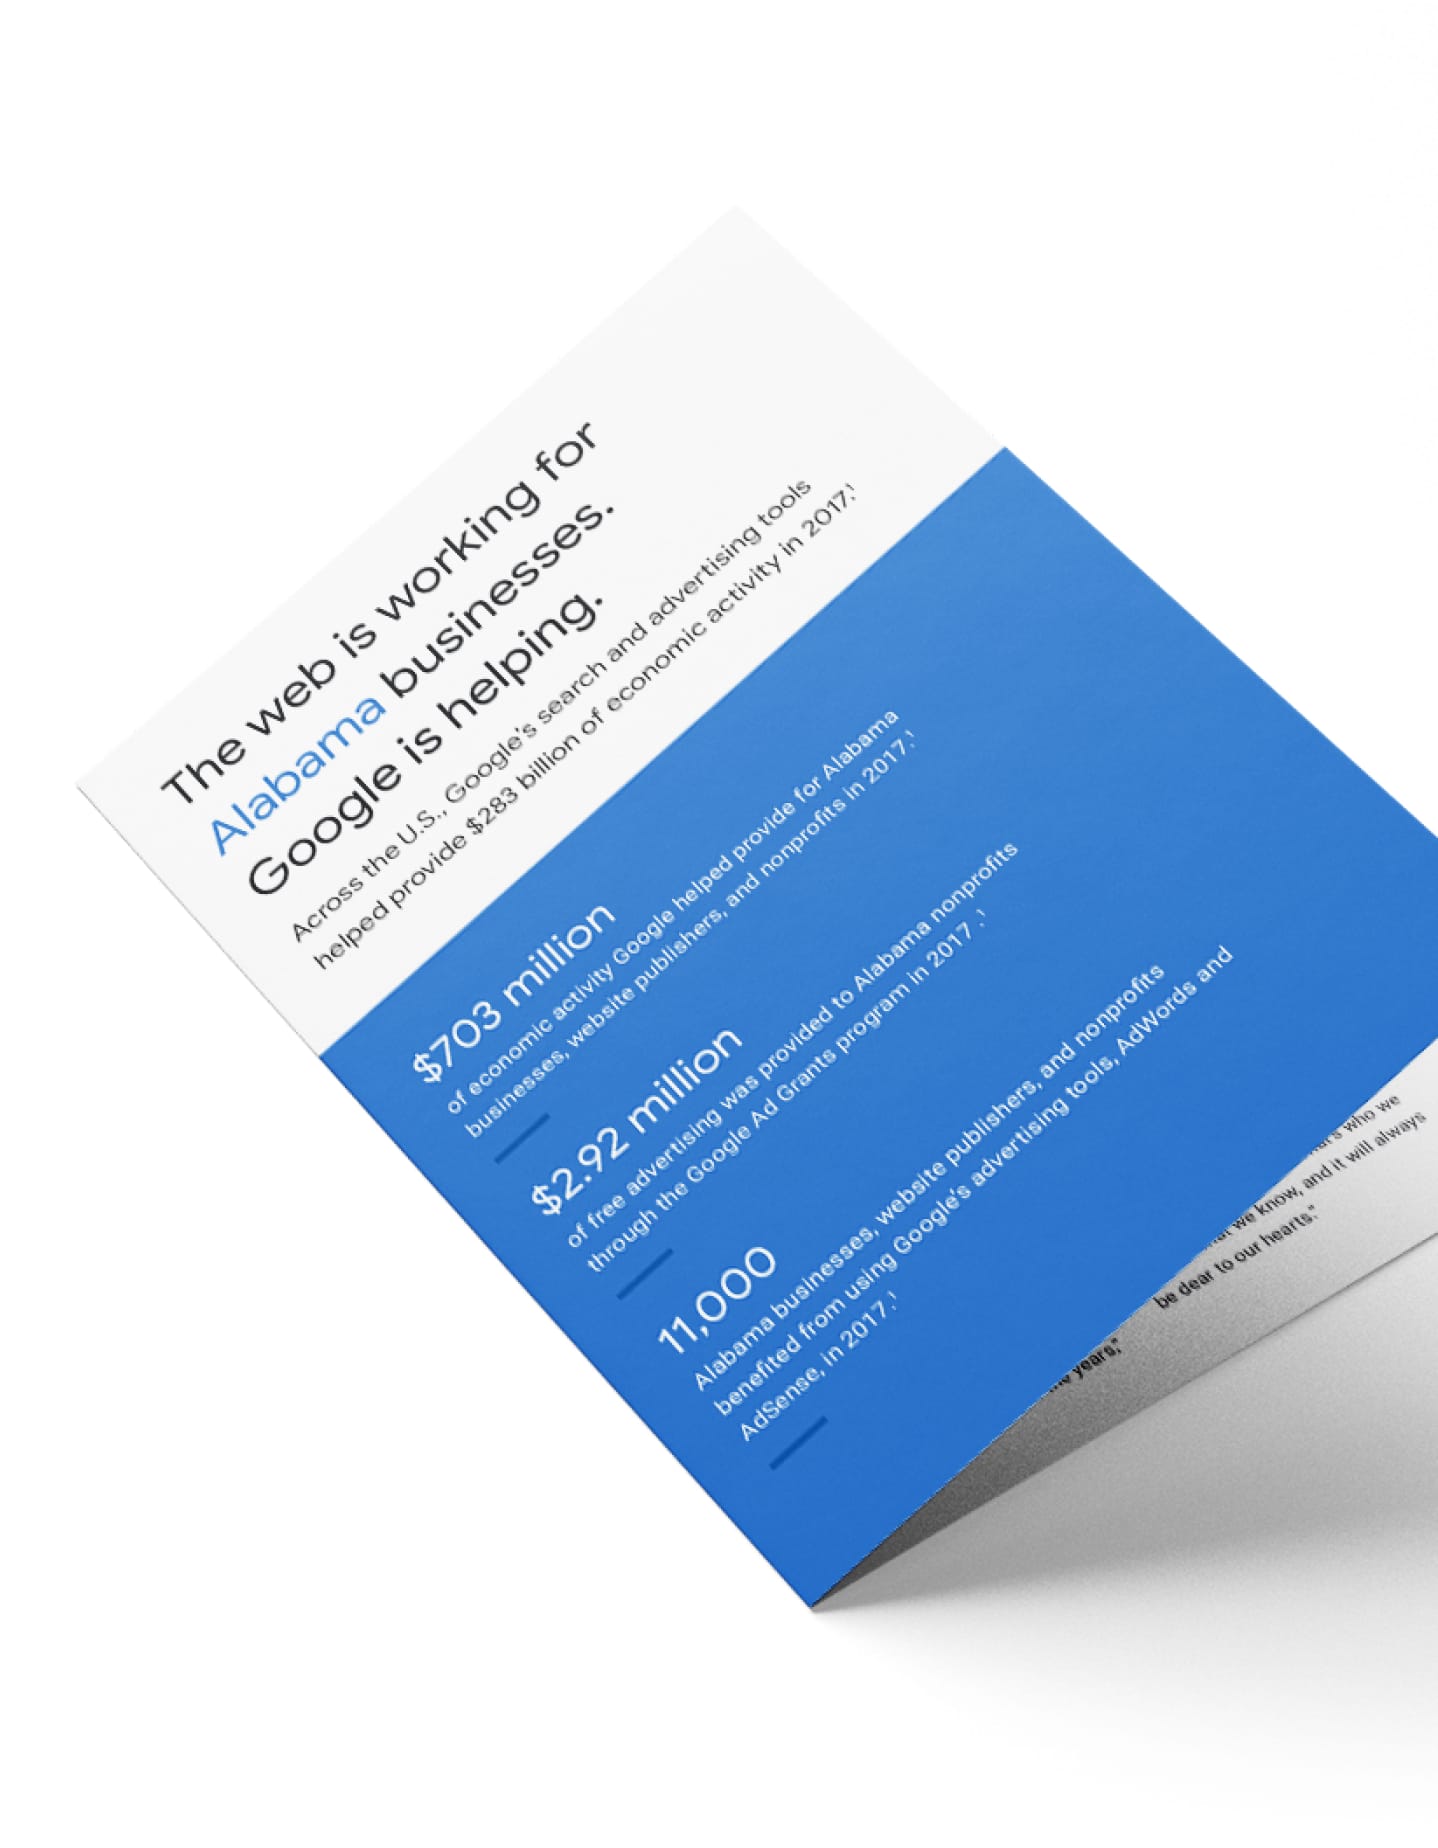
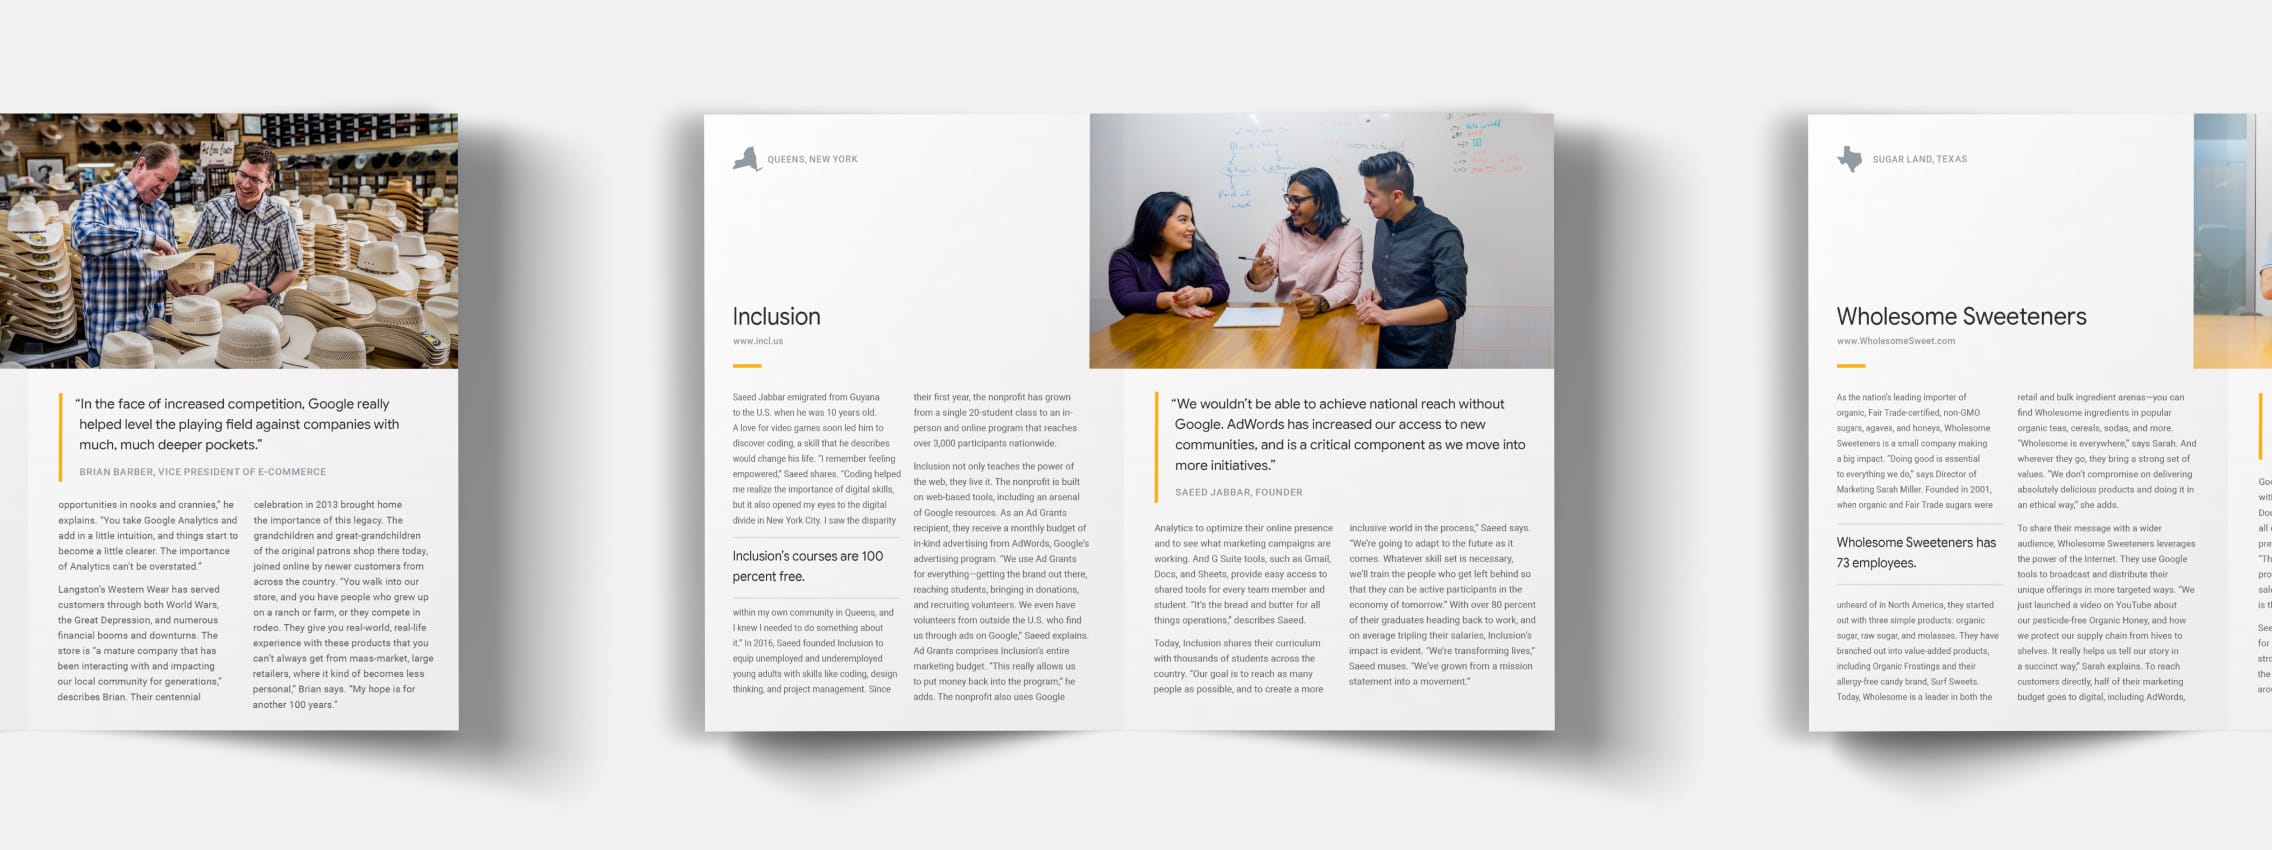
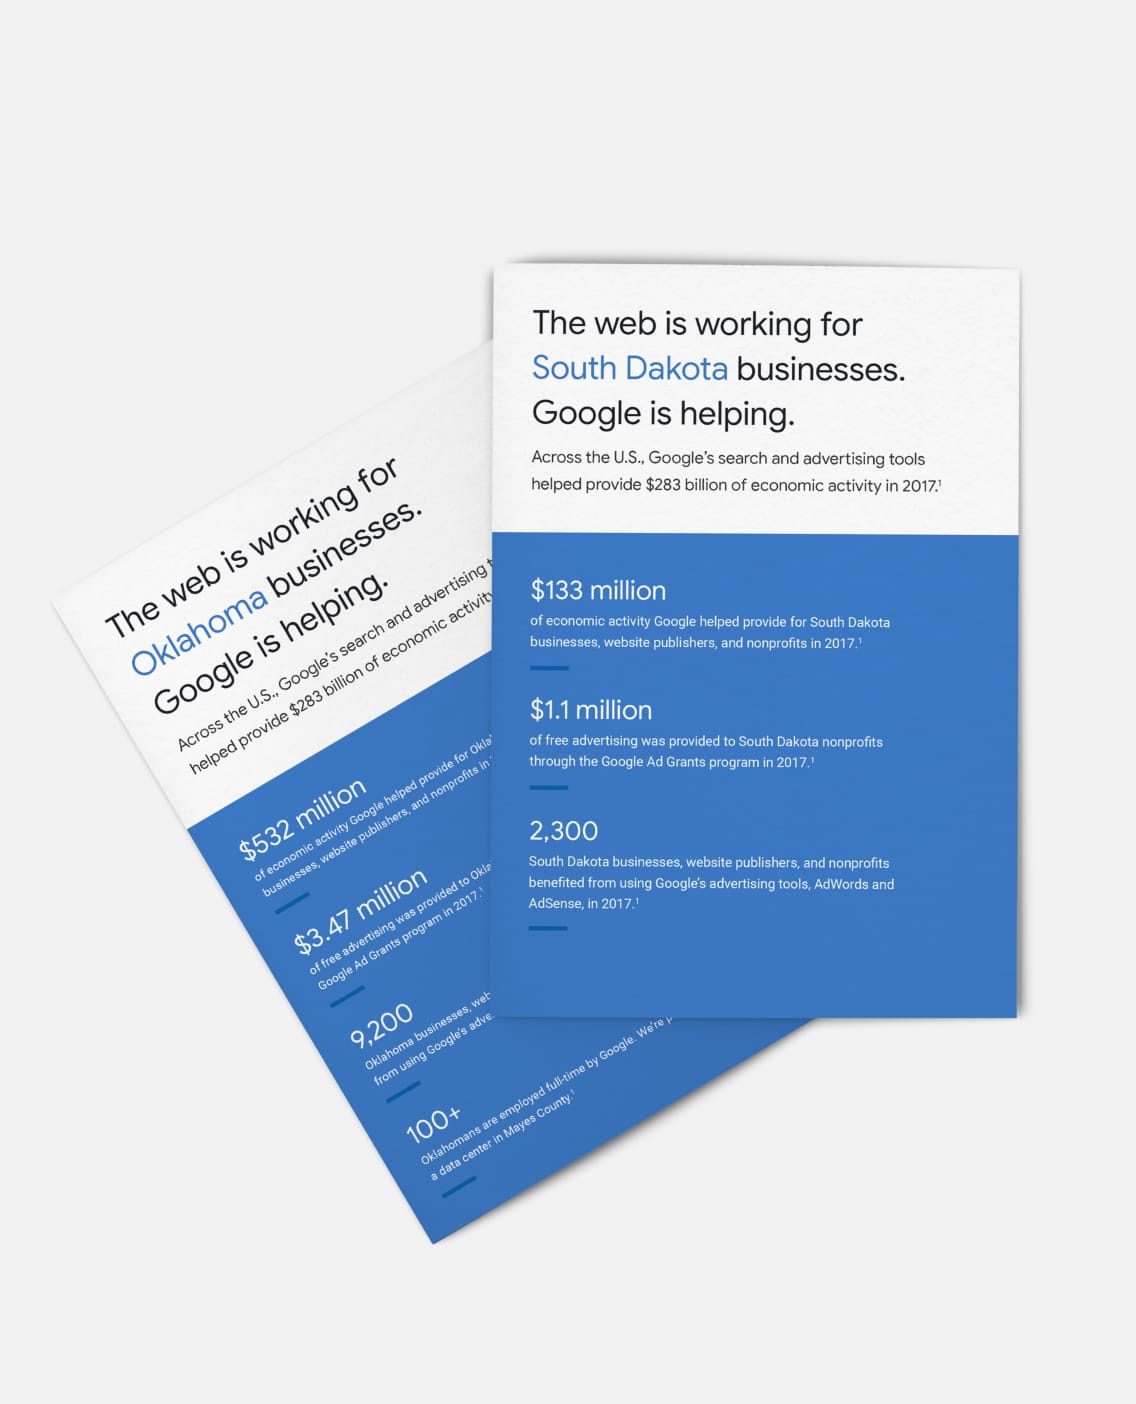
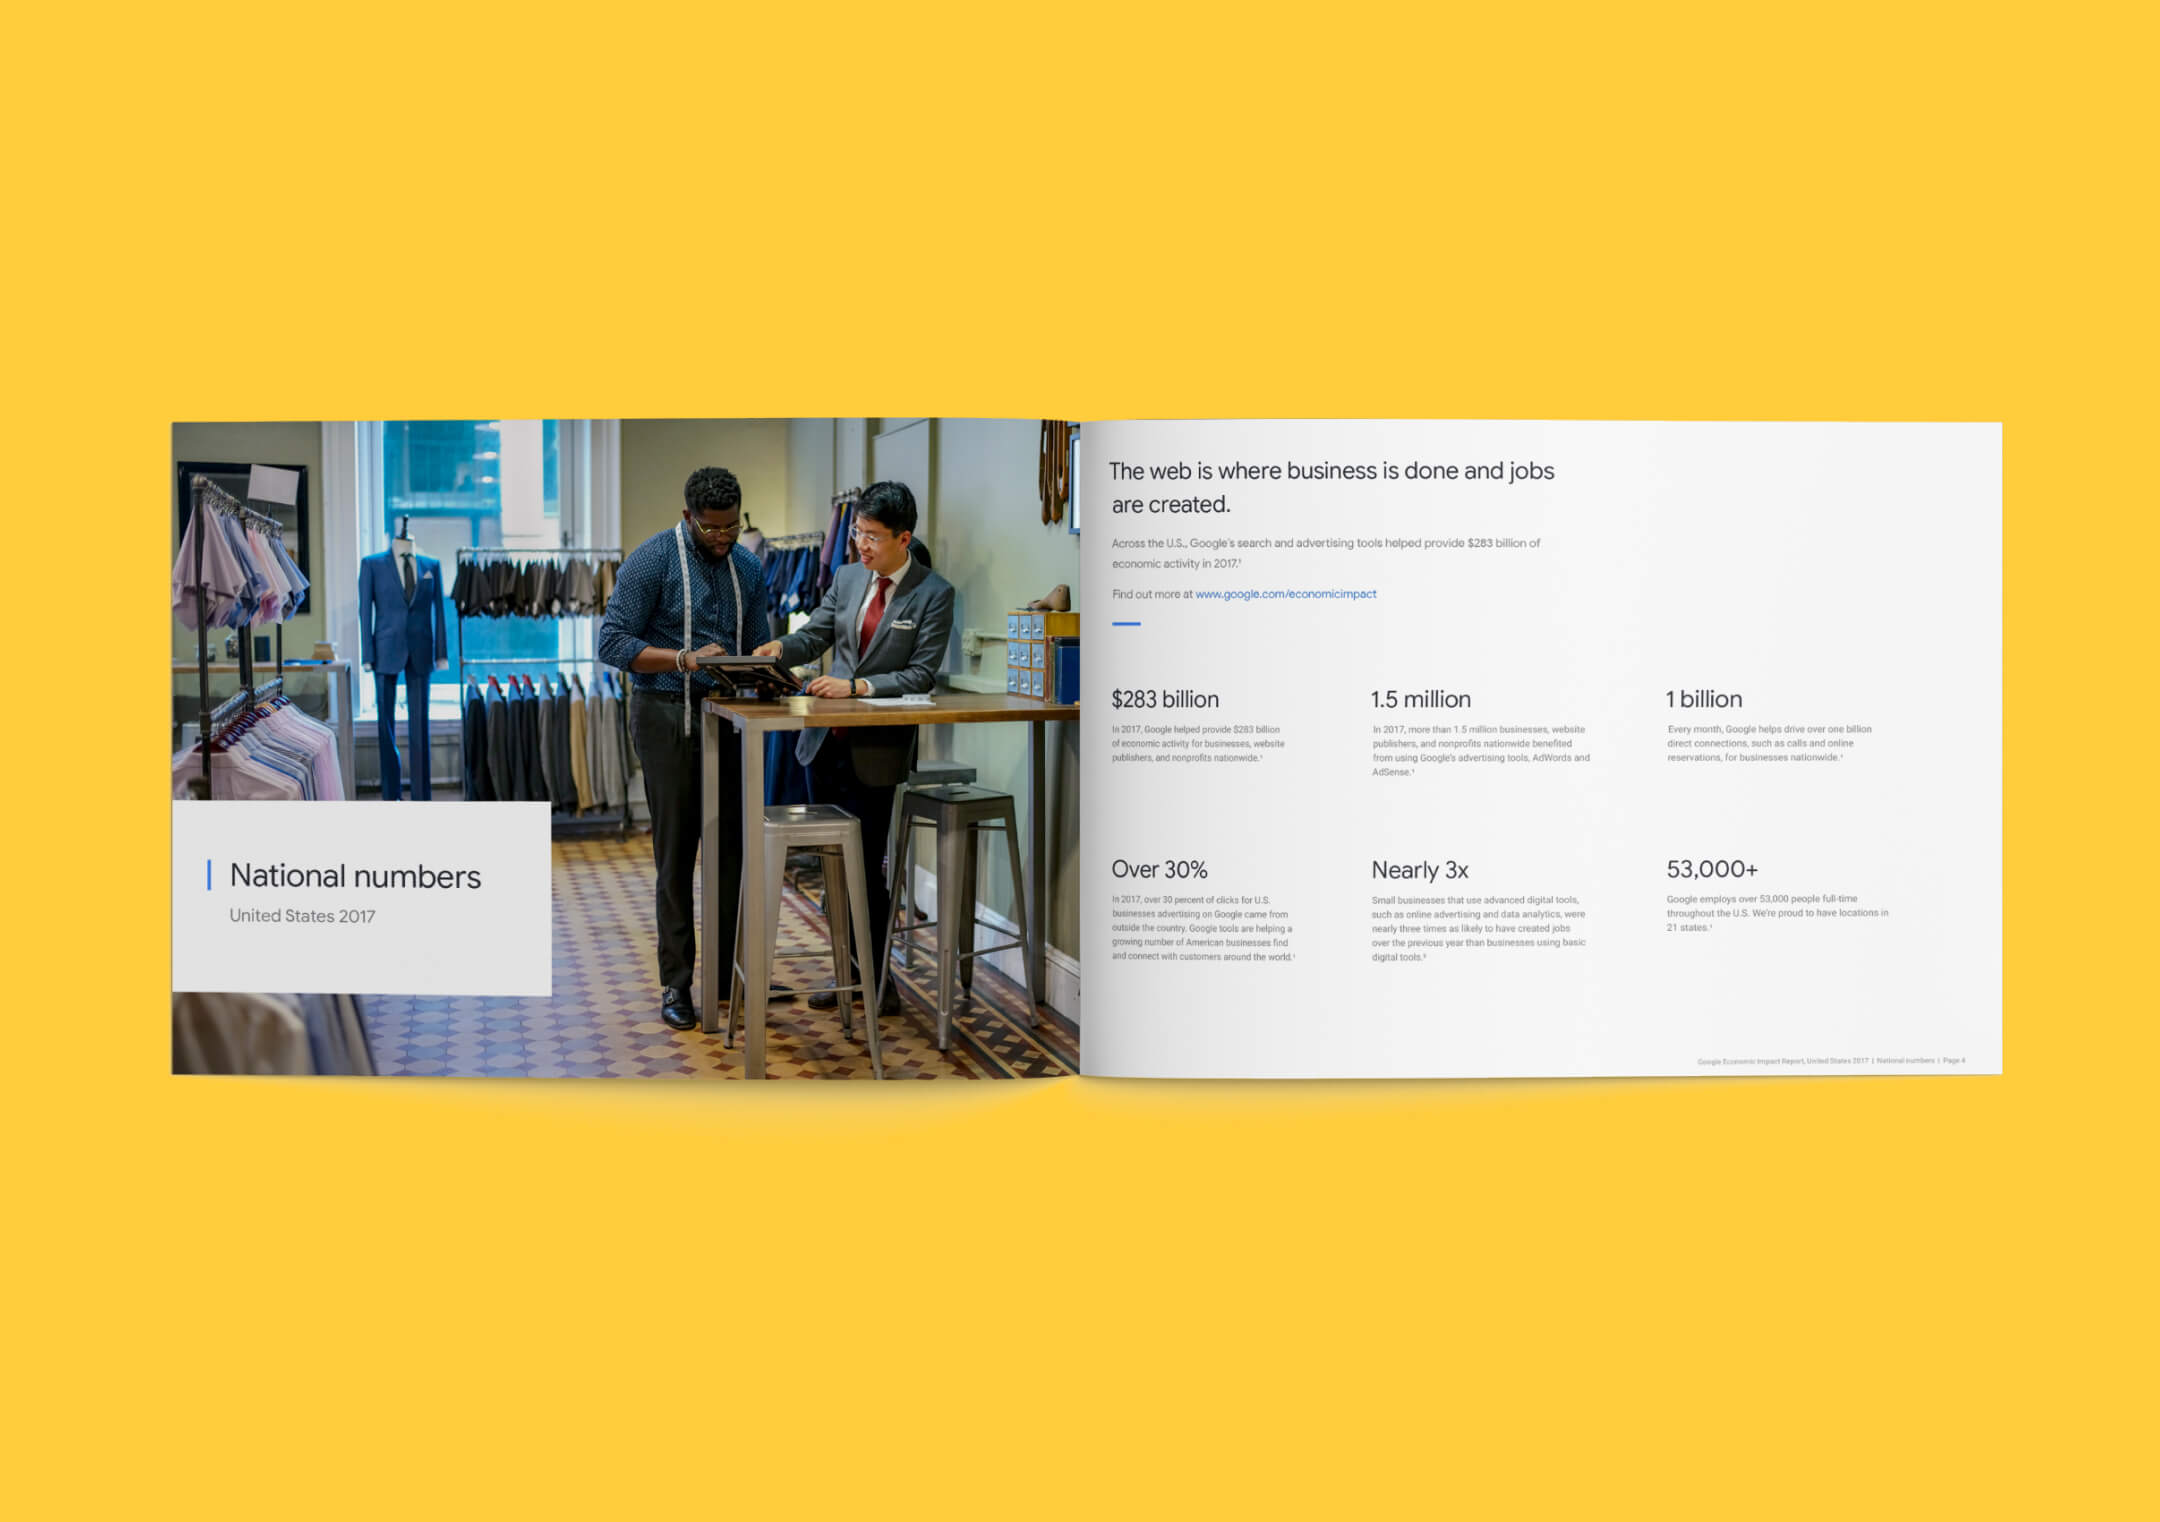
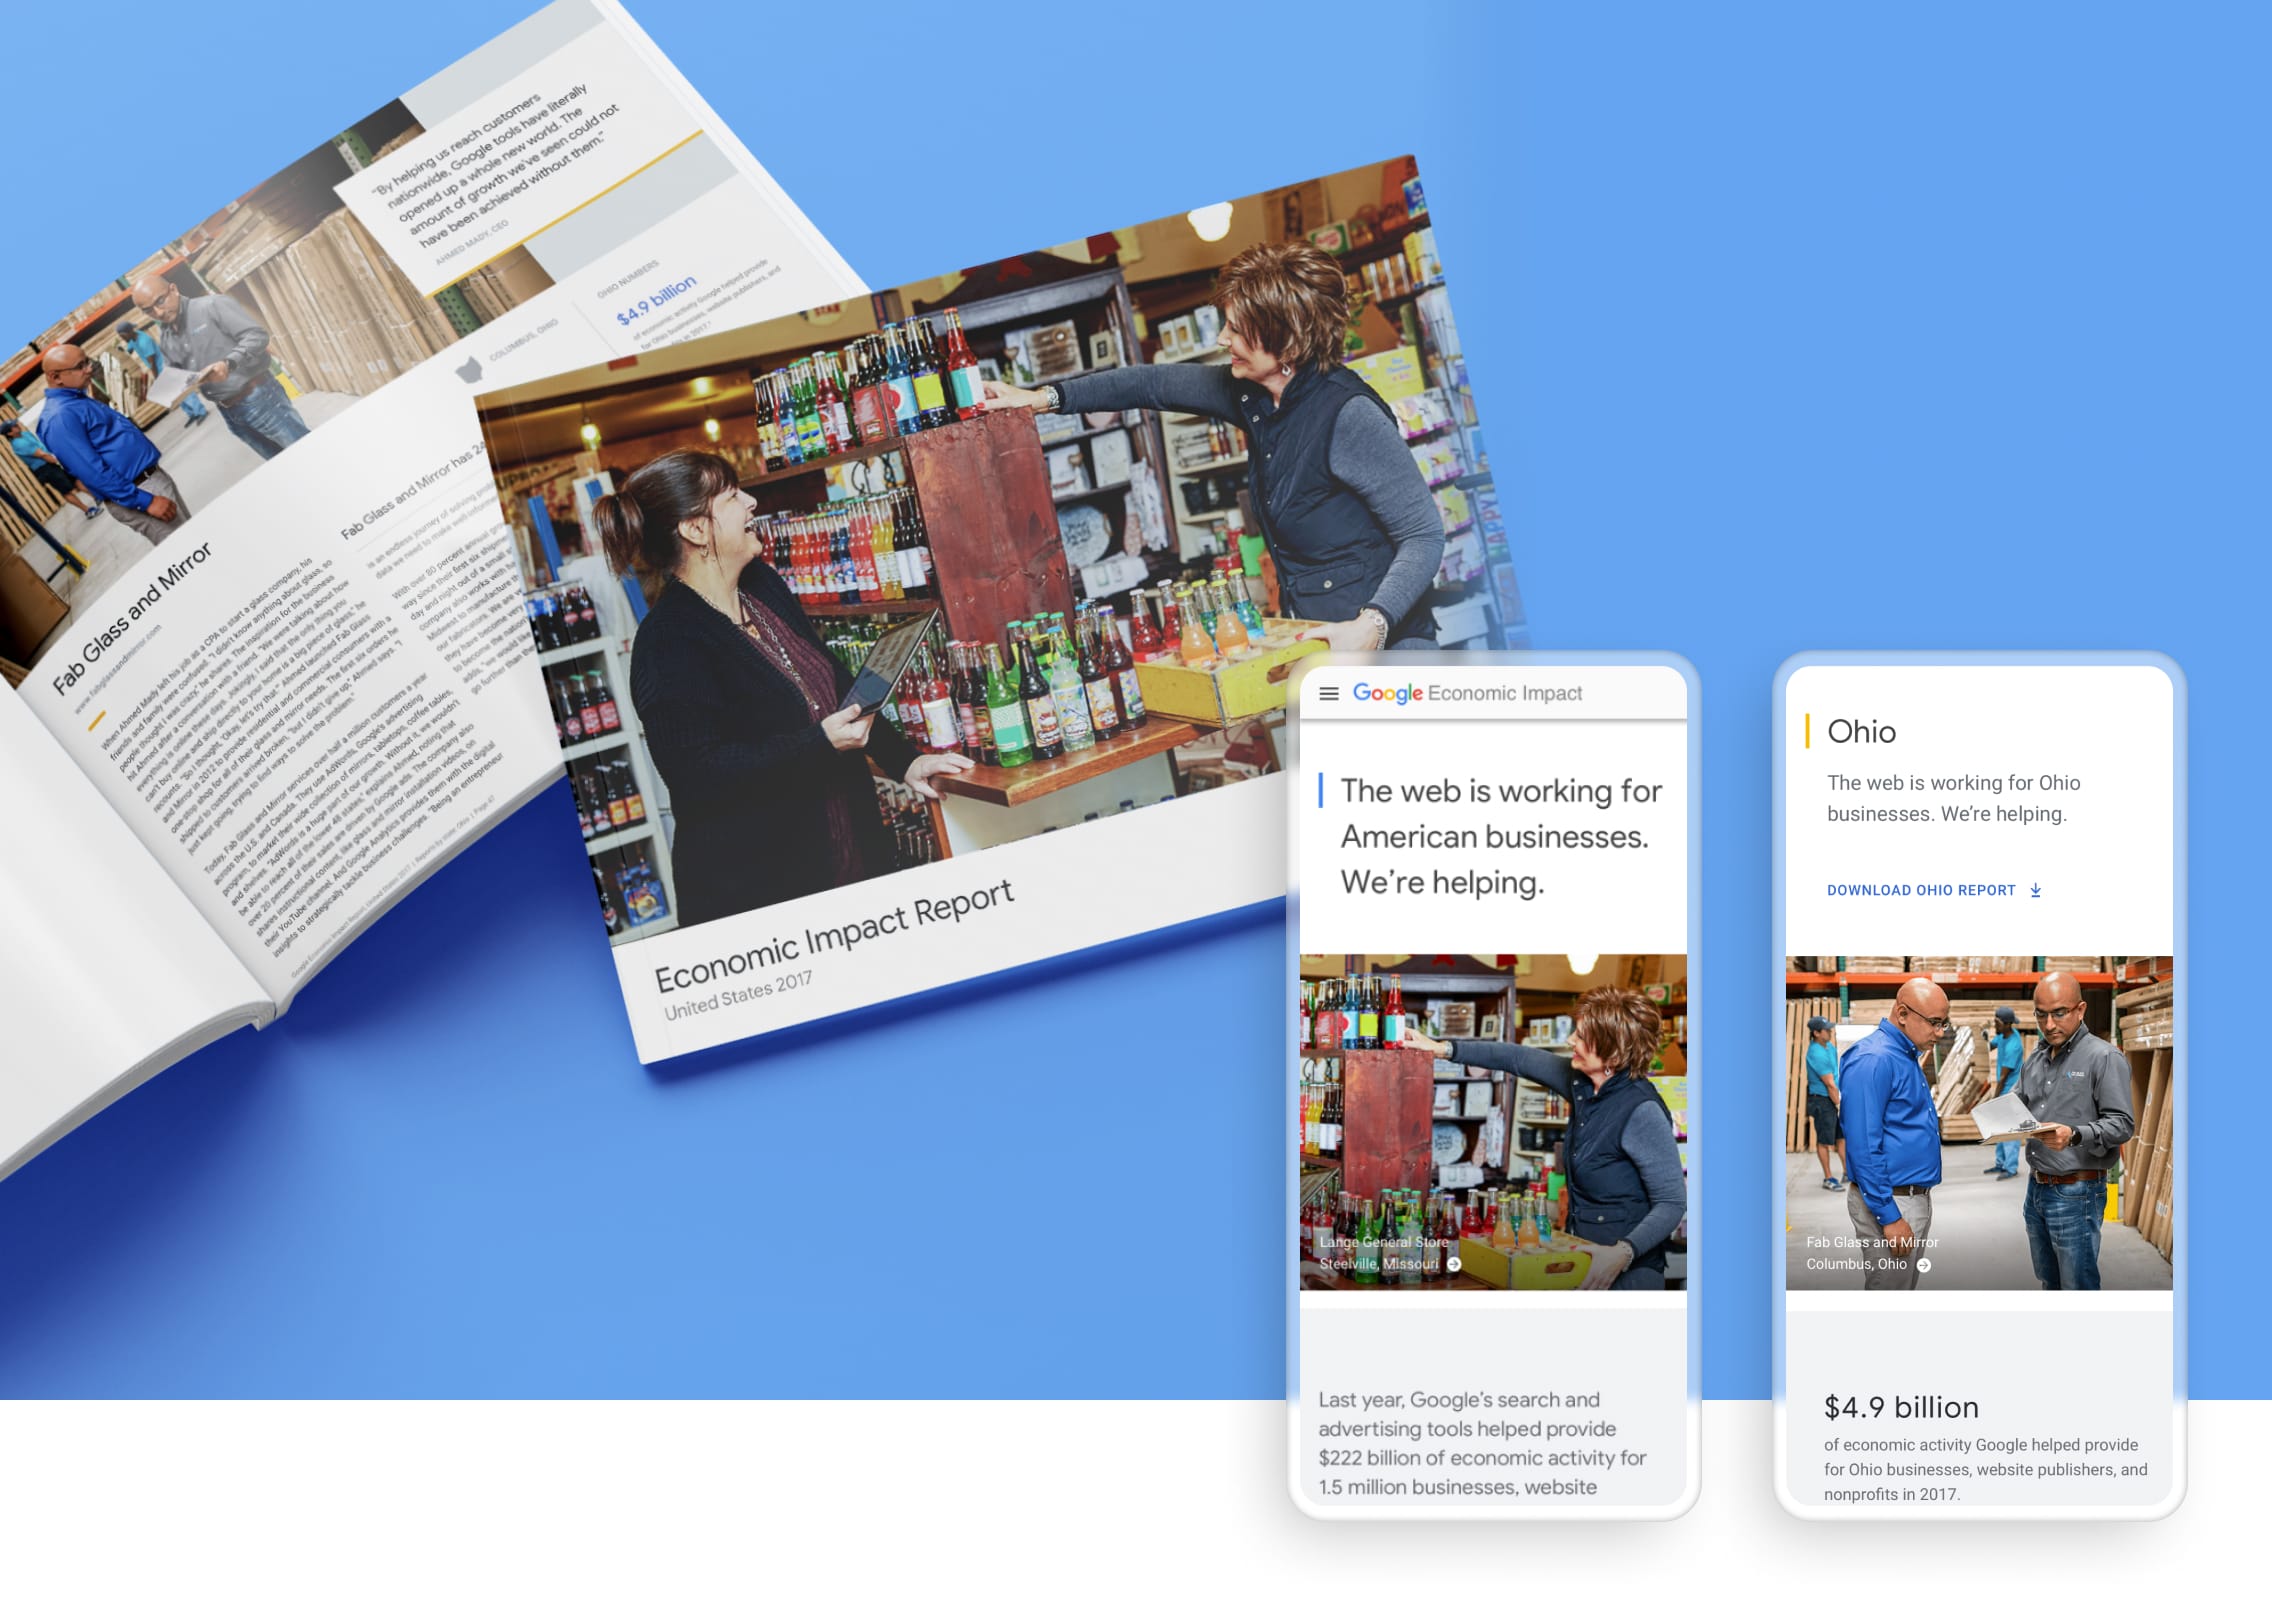
The report exists in three forms: a website, a printed booklet, and 51 individual bifold handouts. Working with a UX designer, developers, a creative director, and Google’s project team, I designed all versions of the report to create a functional, engaging, and cohesive experience.

The Digital Report

We surveyed dozens existing Google web pages and categorized them by level of “Googliness,” or how little or far they stretched from the core Google brand. Taking note of design patterns, we landed on a visual direction that felt distinctly Google but pushed the layout and grid system to include offset and overlapping elements, working in the idea of a layered network and interconnected communities. Using an airy canvas as our base, we allowed the rich photography to shine and brought in brand colors for strategic details.

Featured on Google’s front page

For the launch of the website, a link to the report was featured below the Google search bar, corresponding to the viewer's state report.

The print reports

Alongside the website, we created 51 individual bifold handouts (one for each state and Washington, D.C.) and a 65-page national booklet.

Physical copies of the bifold handouts were sent to each of the featured businesses and organizations, along with a copy of the national booklet.

Design: Halina Mader / UX: Hope Chu / Creative Direction: Chris Royalty / Development: John Moore & John Jandoc