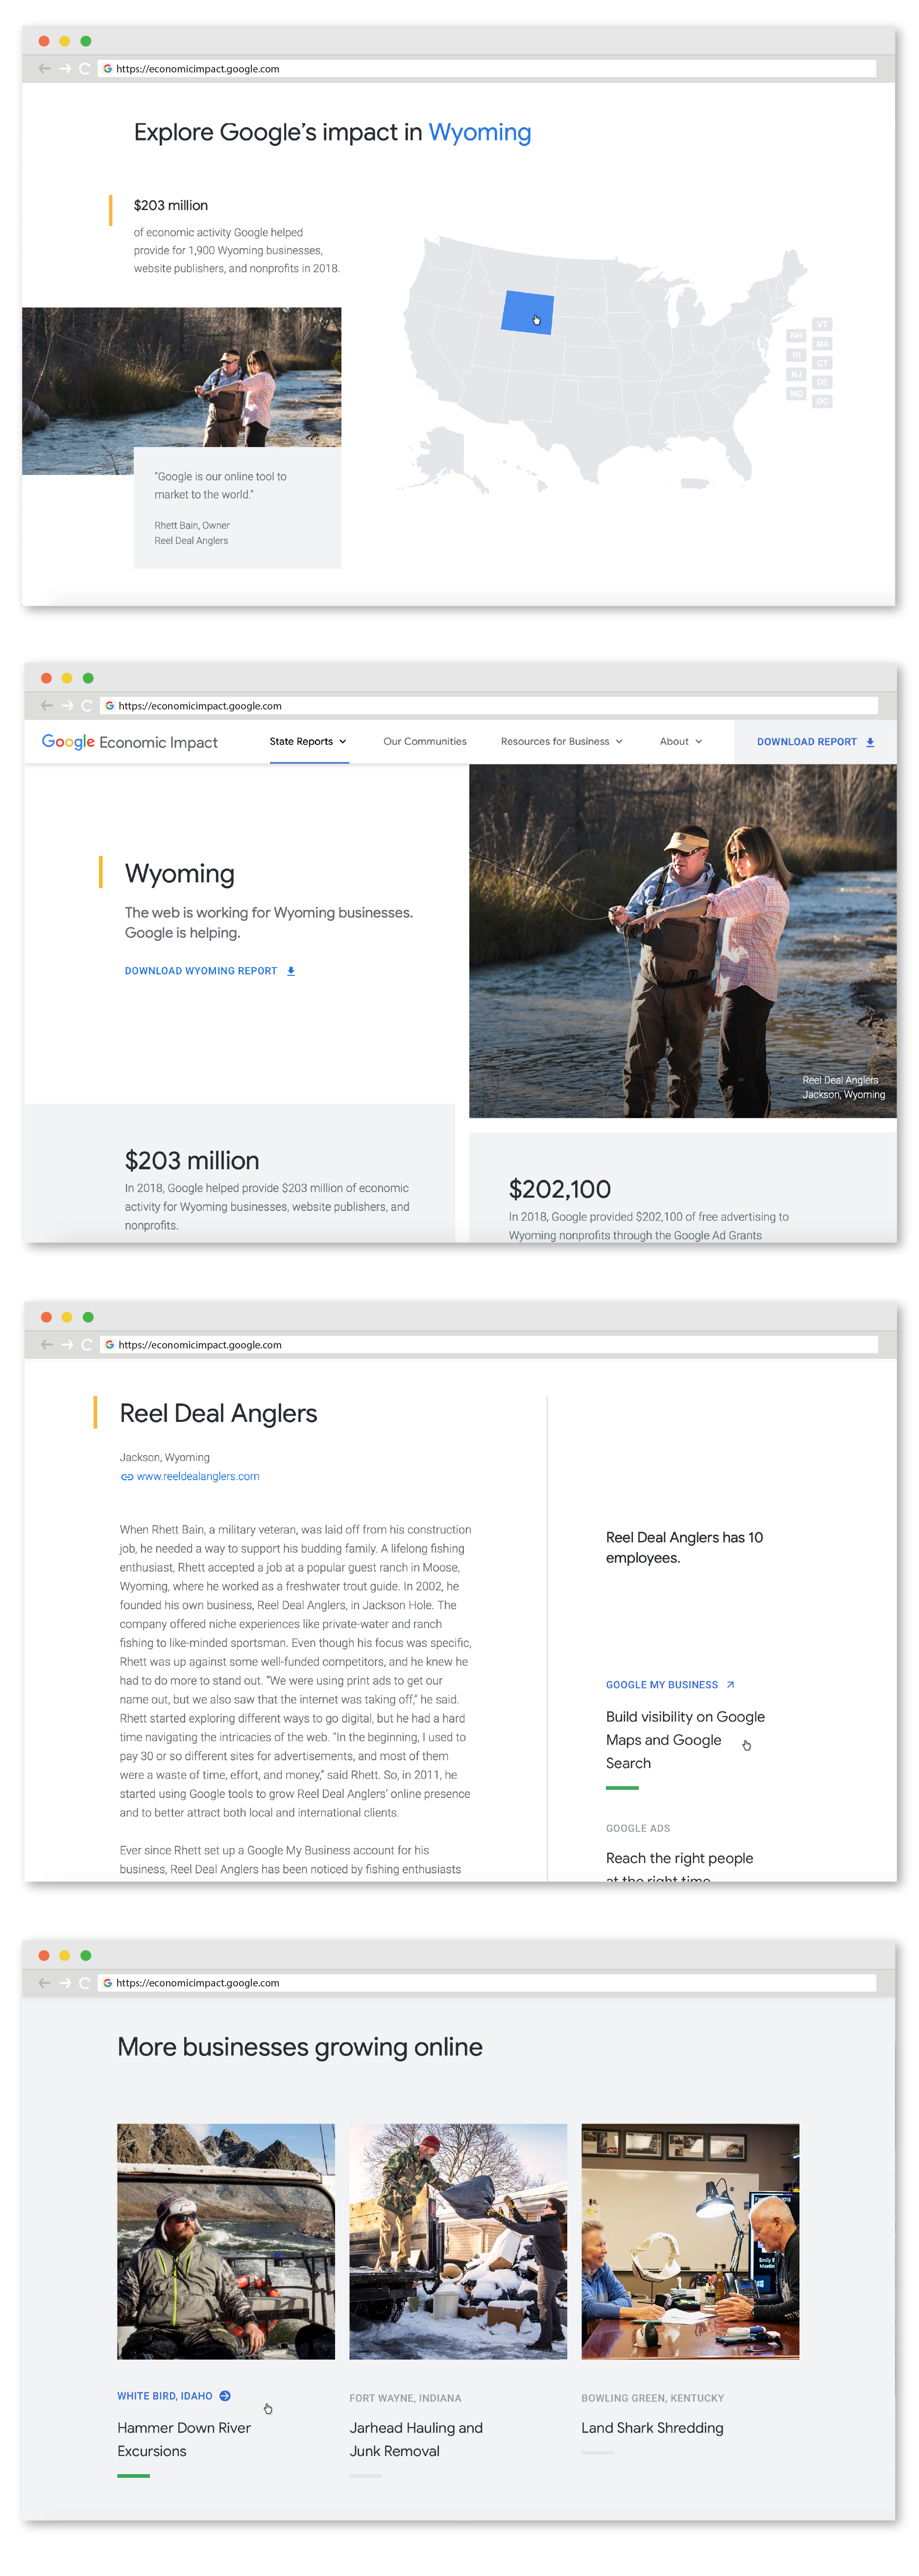
Google releases a report each year illustrating the impact of their tools and programs on businesses, nonprofits, and communities across the United States. In it, they detail their methodology and statistics as well as highlight stories of the small businesses and organizations that grew as a result of the internet and Google's role.
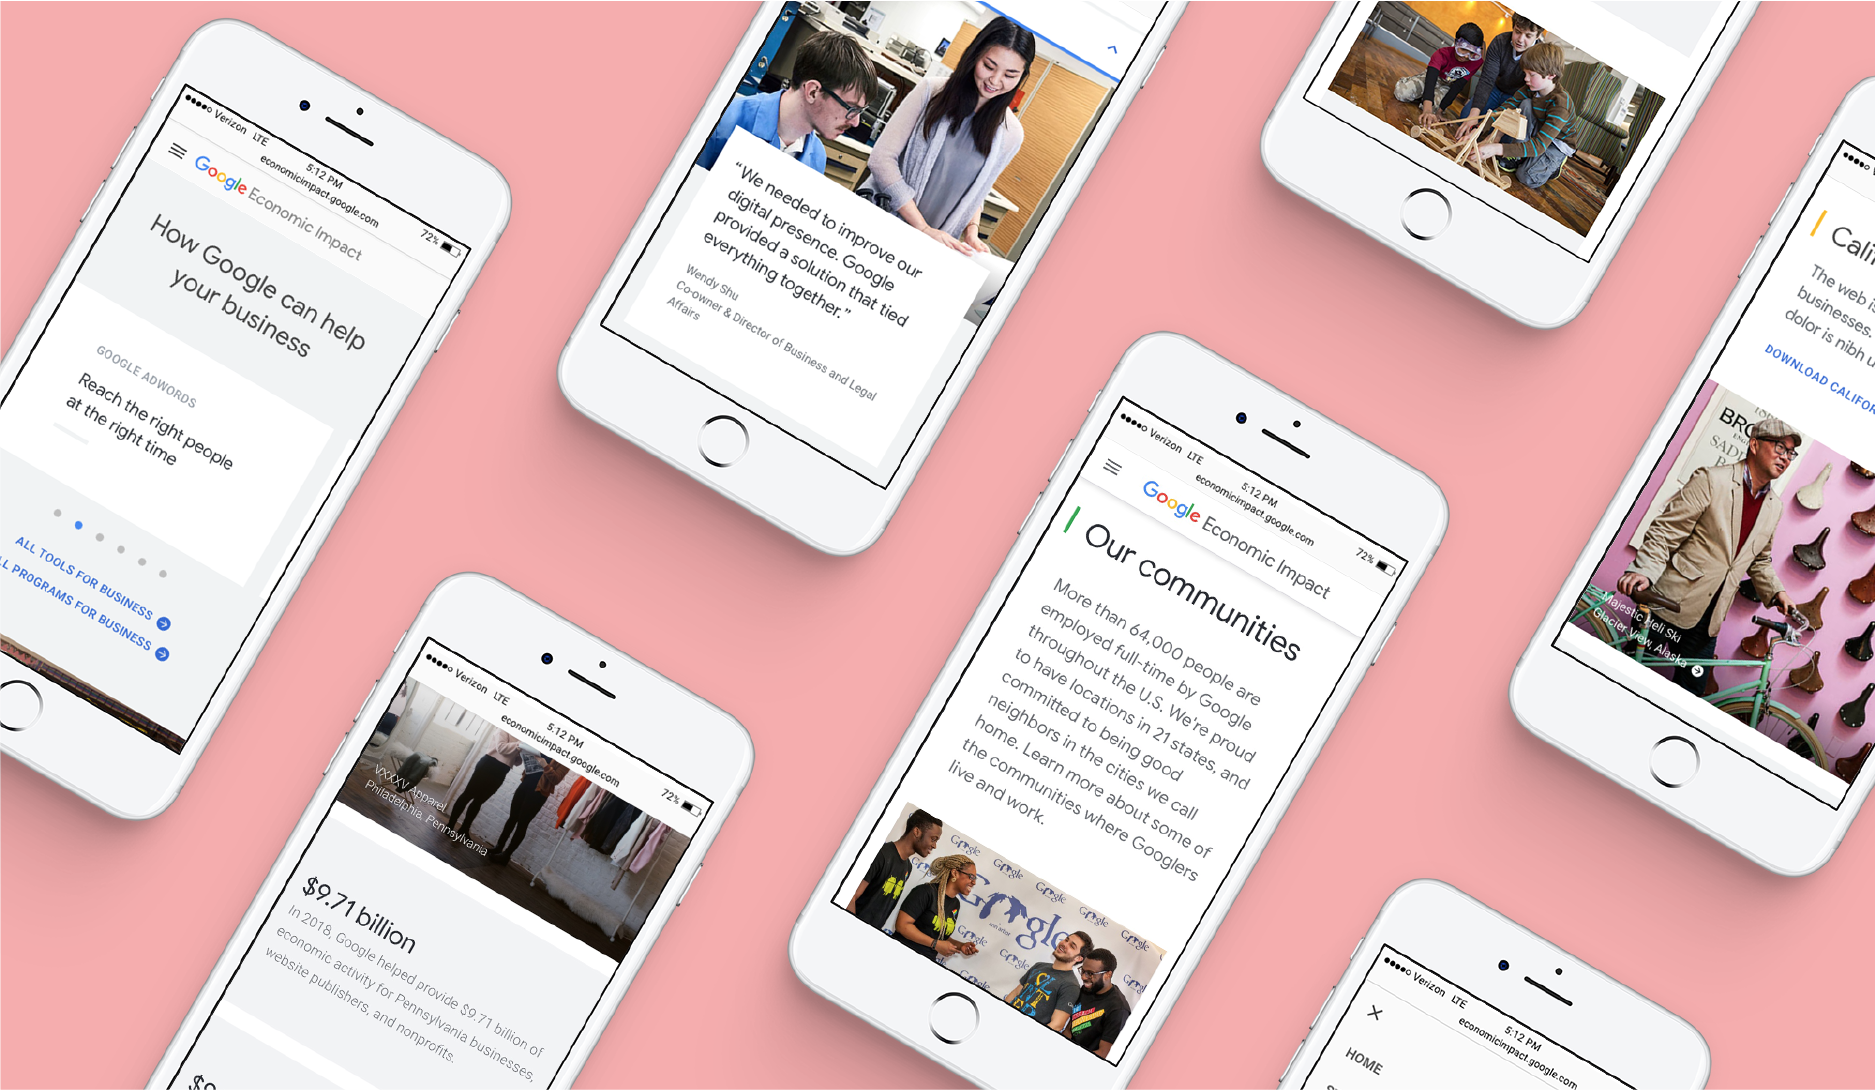
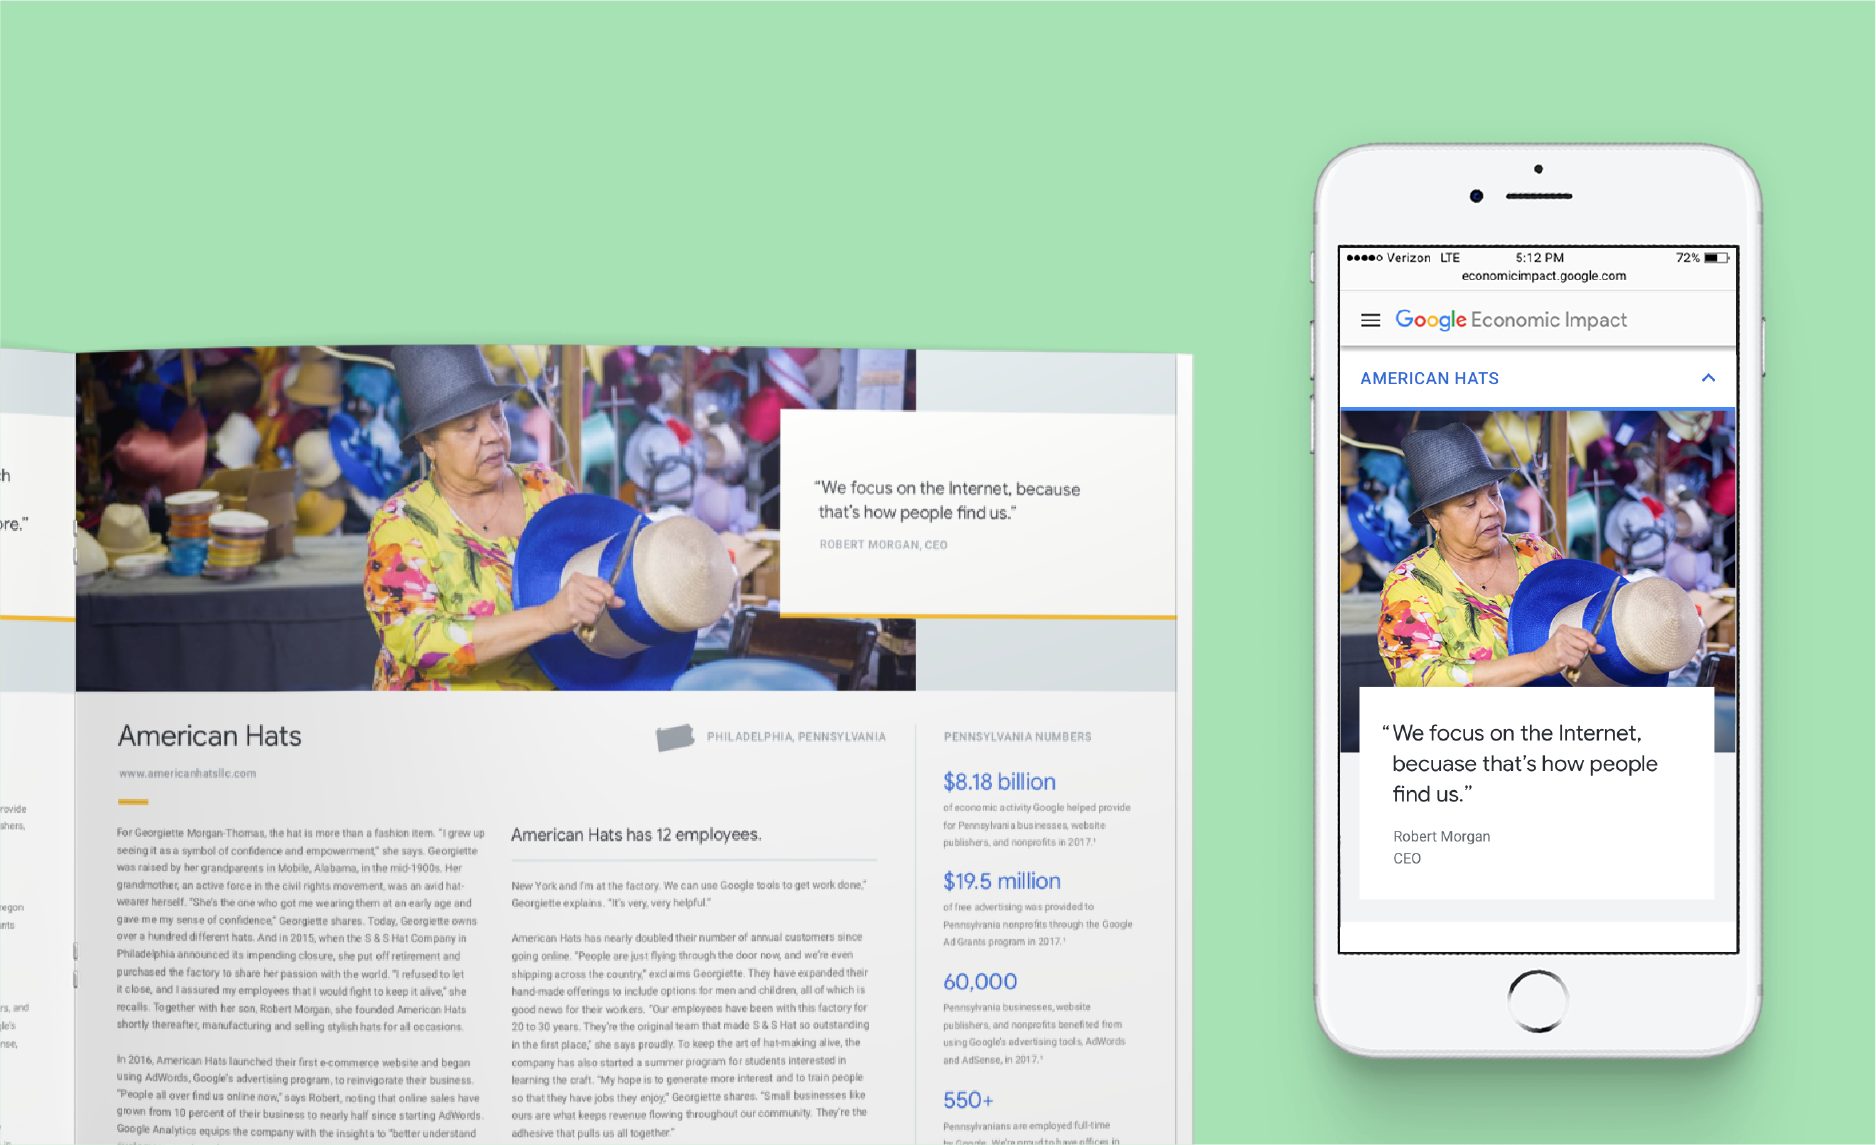
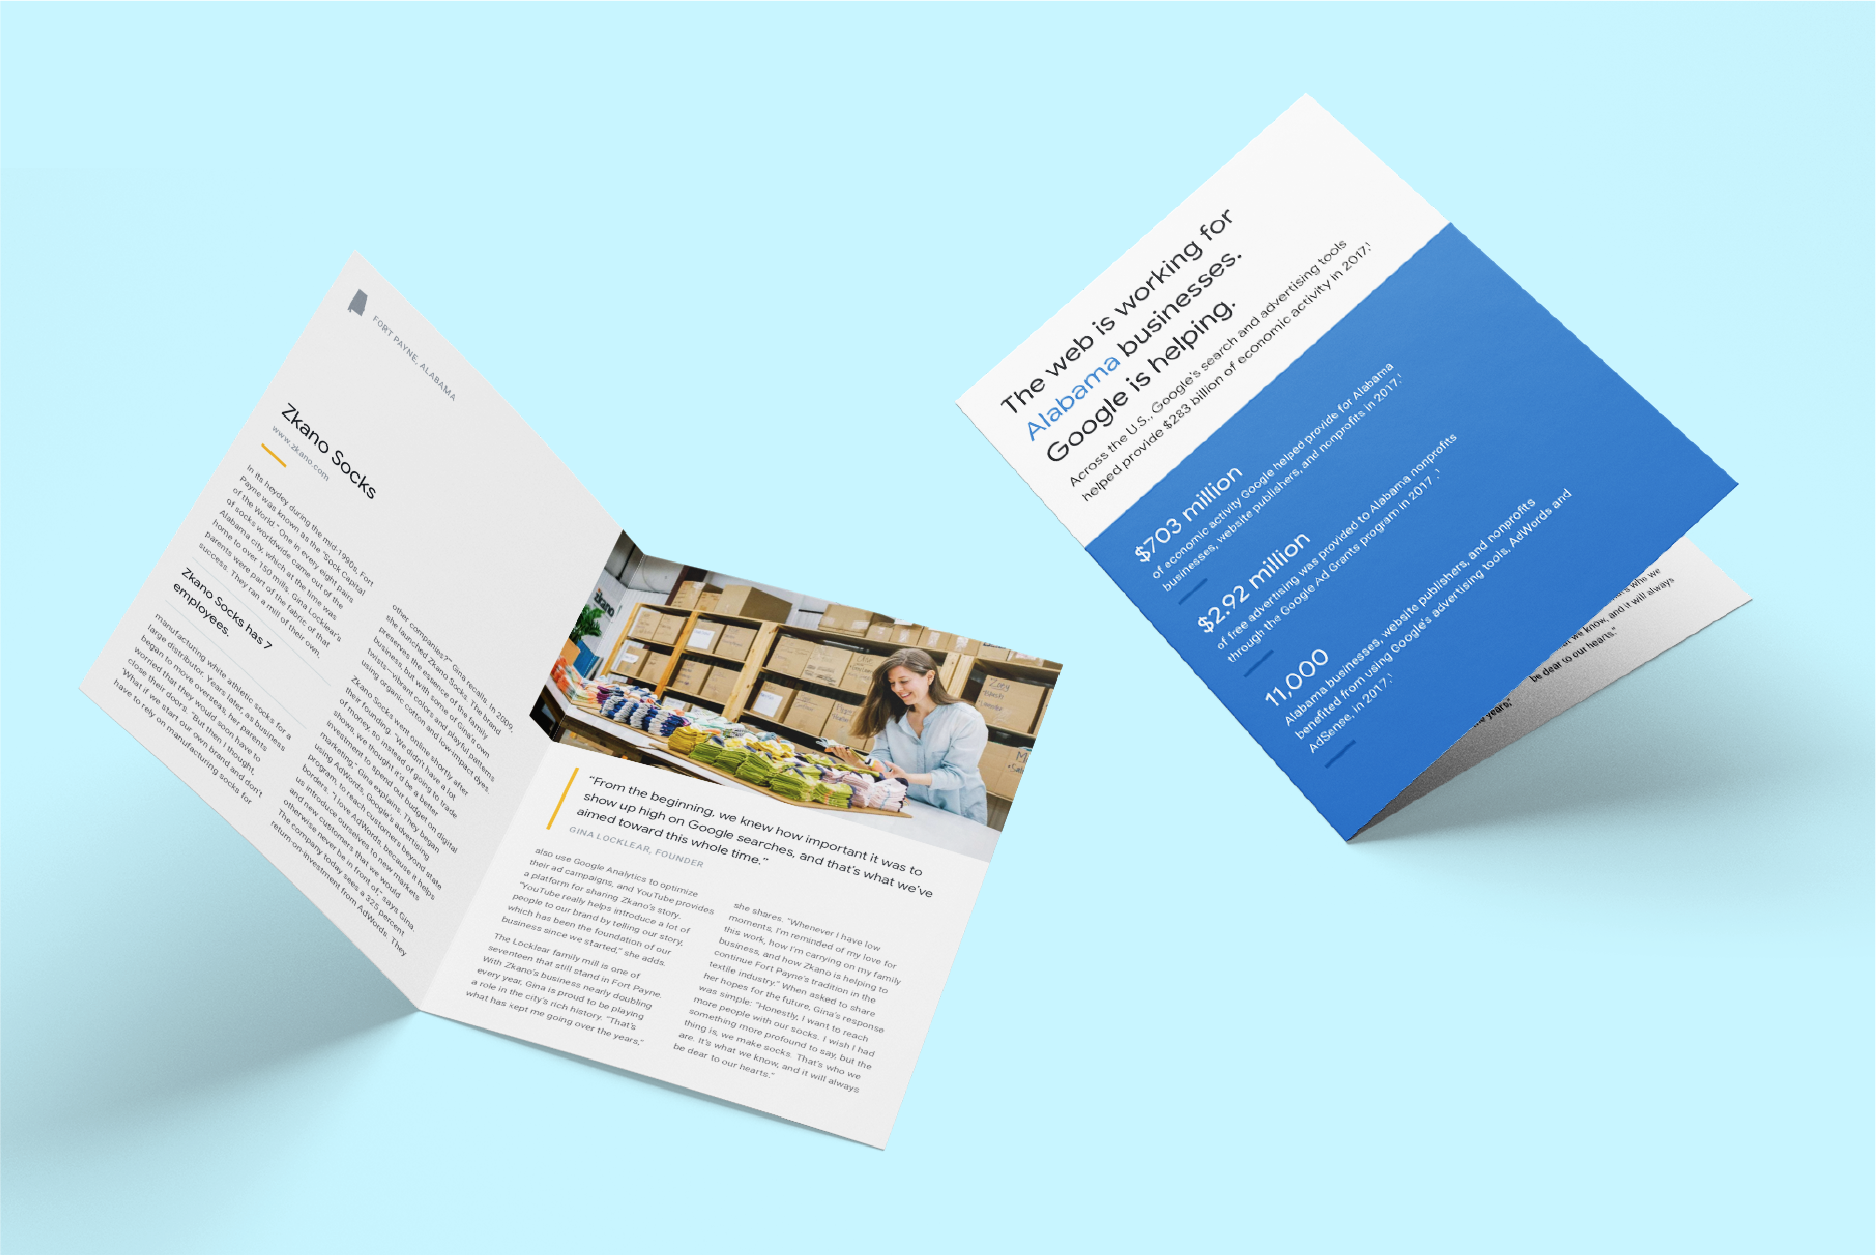
This report exists digitally as a website, as a printed booklet including all 50 states and D.C., and as 51 individual bifold handouts. All elements must be cohesive across mediums and devices, communicate a mountain of data cleanly, and feel distinctly Google. I designed both the digital and the print versions of the 2017 and 2018 reports, working with a UX designer and developers to create a functional and engaging interactive web experience.
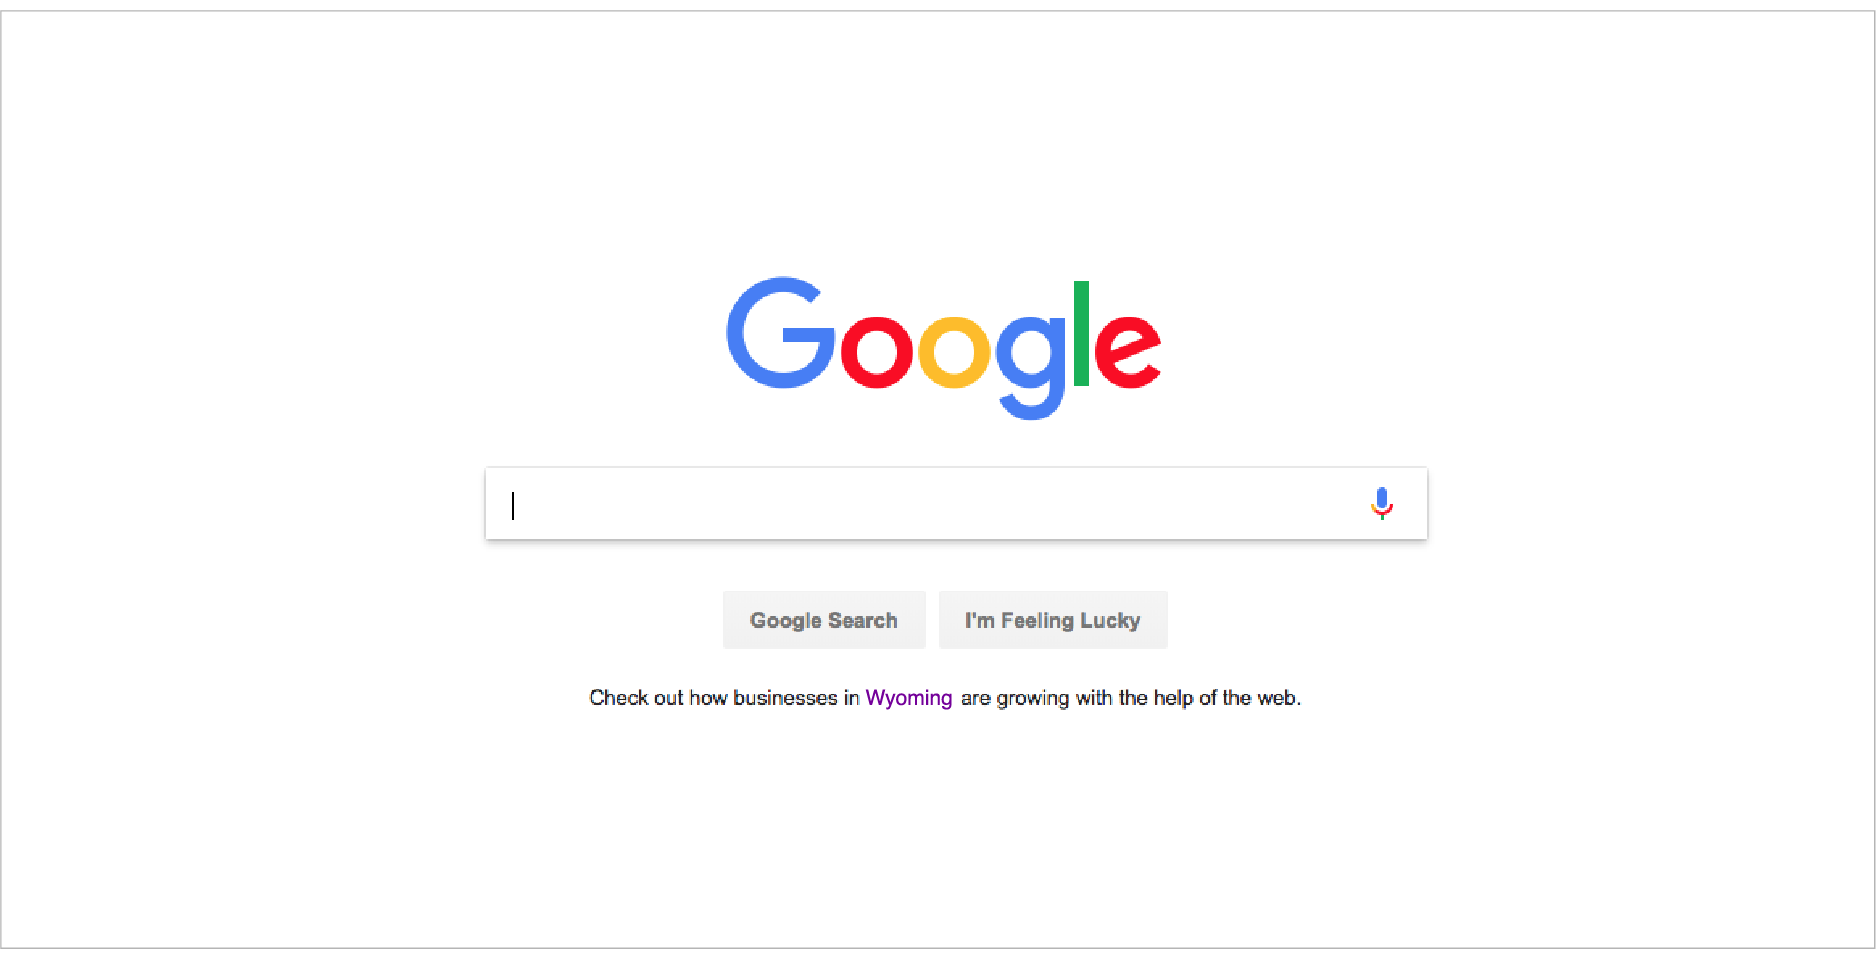
The report was featured on the Google home page, linking to the location-determined state report page. View the 2017 booklet here.